
Collect & visualize your logs with Logstash, Elasticsearch & Redis
Update of December 6th : although Logstash does the job as a log shipper, you might consider replacing it with Lumberjack / Logstash Forwarder, which needs way less resources, and keep Logstash on your indexer to collect, transform and index your logs data (into ElasticSearch) : check out my latest blog post on the topic.
Even if you manage a single Linux server, you probably already know how hard it is to keep an eye on what's going on with your server, and especially tracking logs data. And this becomes even worse when you have several (physical or virtual) servers to administrate.

Although Munin is very helpful monitoring various informations from my servers / VMs, I felt the need of something more, and bit less static / more interactive. There are 3 kind of logs I especially wanted to track :
- Apache 2 access logs
- iptables logs
- Syslogs
After searching arround on the internet for a great tool that would help me, I read about the open source log management tool Logstash which seems to perfectly suit a (major) part of my needs : logs collecting / processing. For the purpose of this post, I will take the following network architecture and assume and I want to collect my Apache, iptables, system logs from servers 1/2/3 ("shippers") on server 4 ("indexer") and visualize them :
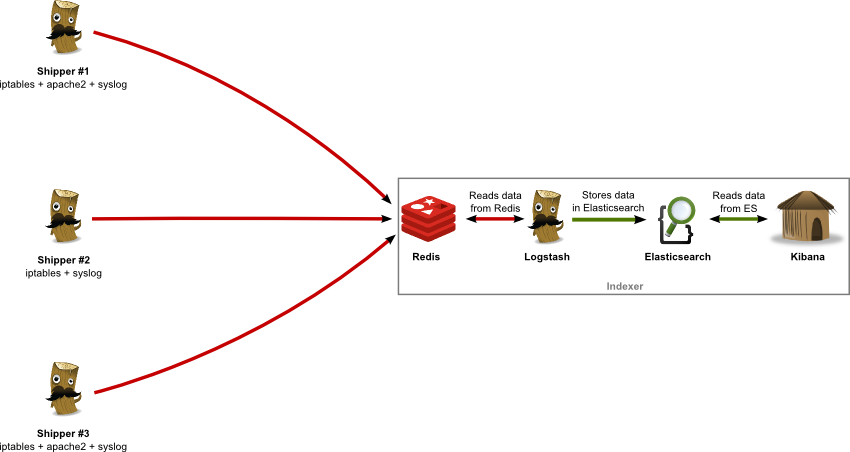
As you can see, I am using 4 complementary applications, the role of each one being :
- Logstash : logs collector, processor and shipper (to Redis) on log "shippers" 1-3 ; logs indexer on server 4 (reads from Redis, writes to Elasticsearch)
- Redis : logs data broker, receiving data from log "shippers" 1-3
- Elasticsearch : logs data persistent storage
- Kibana : (time-based) logs data visualization (graphs, tables, etc.)
Installation
As shown on the schema above, I will describe how to install all of Logstash + Redis + Elasticsearch + Kibana on the same "indexer" server. You may want to separate these on different servers for any reason, just set the correct IPs / hostnames accordingly, in the examples below.
Redis

First of all, let's install Redis on our indexer server (right, that's #4 on the schema). As the versions of Redis available in Linux distributions repositories are not up to date, we'll download the last stable release from Redis' website :
$ sudo aptitude install gcc
$ wget http://download.redis.io/releases/redis-2.6.16.tar.gz
$ tar xzf redis-2.6.16.tar.gz
$ cd redis-2.6.16
$ make MALLOC=libc
$ sudo cp src/redis-server /usr/local/bin/
$ sudo cp src/redis-cli /usr/local/bin/
Launch redis-server (sudo redis-server), try to ping Redis to see if server is working :
$ redis-cli ping
If you get a PONG reply, your Redis server works fine. You might want to install Redis more properly, if so, follow this excellent guide at Redis.io. You're now ready to ship logs data from your servers to Redis. Note that Redis listens on it's default port (tcp/6379) and accepts incoming connections from any IP :
$ netstat -tanpu|grep redis
tcp   0   0   0.0.0.0:6379   0.0.0.0:*   LISTEN   16955/redis-server
Logstash (shippers)
You will need to set an instance of Logstash on each of your servers you want to collect data from, it will act as a "logs shipper". Open a shell on one of the servers you want to collect log data from, and dowload logstash.
$ sudo mkdir /opt/logstash /etc/logstash
$ sudo cd /opt/logstash
$ sudo wget https://download.elasticsearch.org/logstash/logstash/logstash-1.2.2-flatjar.jar
Create a Logstash config file in /etc/logstash :
input { stdin { } }
output { stdout { codec => rubydebug } }
Now launch the logstash agent and type something, you should get something like this :
$ java -Xmx256m -jar logstash-1.2.2-flatjar.jar agent -f logstash-test.conf
hello world
{
  "message" => "hello world",
  "@timestamp" => "2013-11-17T18:35:56.672Z",
  "@version" => "1",
  "host" => "myhostname"
}
Logstash works fine, let's configure it to work with our previously-installed Redis instance. Create a new config file :
input { stdin { } }
output {
  stdout { codec => rubydebug }
  redis { host => "10.0.0.5" data_type => "list" key => "logstash" }
}
You'll of course need to replace "10.0.0.5" by the IP of your server Redis is running on. Launch logstash agent with logstash-redis.conf as config file and type something as above. Then, on your indexer server (where Redis is installed), launch redis-cli :
redis 127.0.0.1:6379> LLEN logstash
(integer 1)
redis 127.0.0.1:6379> LPOP logstash
"{\"message\":\"hello redis\",\"@timestamp\":\"2013-11-17T20:35:13.910Z\",\"@version\":\"1\",\"host\":\"myhostname\"}"
Here it is, we've got our message transmitted by Logstash to our Redis server. You've probably noticed that Logstash added a few fields to our initial (minimalistic) data (@timestamp, @version and host). Now that we've got Logstash able to send data to Redis, we can begin processing our Apache 2 and iptables logs.
Apache 2 logs processing
Create a new config file in /etc/logstash :
input {
  file {
    path => "/var/log/apache2/*access.log"
    type => "apache"
  }
}

filter {
  if [type] == "apache" {
    grok {
      pattern => "%{COMBINEDAPACHELOG}"
    }
  }
}

output {
  redis { host => "10.0.0.5" data_type => "list" key => "logstash" }
}
This config is quite self-explanatory ; few things although :
- type => "apache" allows us to use conditionals further
- pattern => "%{COMBINEDAPACHELOG}" is a built-in regex-like used to match against our Apache logs lines and extract fields (request, host, response, etc.)
Launch the logstash agent, and you're done. It's that simple ! You should now see the logstash list count grow in Redis (LLEN logstash) as your Apache gets hits.
iptables logs processing
There is no built-in grok pattern available to extract data from iptables logs, but there's one available in Logstash's cookbook config snippets. Create a directory where you will keep your custom grok patterns (i.e. /usr/share/grok/patterns) and create a new file called iptables :
# Source : http://cookbook.logstash.net/recipes/config-snippets/
NETFILTERMAC %{COMMONMAC:dst_mac}:%{COMMONMAC:src_mac}:%{ETHTYPE:ethtype}
ETHTYPE (?:(?:[A-Fa-f0-9]{2}):(?:[A-Fa-f0-9]{2}))
IPTABLES1 (?:IN=%{WORD:in_device} OUT=(%{WORD:out_device})? MAC=%{NETFILTERMAC} SRC=%{IP:src_ip} DST=%{IP:dst_ip}.*(TTL=%{INT:ttl})?.*PROTO=%{WORD:proto}?.*SPT=%{INT:src_port}?.*DPT=%{INT:dst_port}?.*)
IPTABLES2 (?:IN=%{WORD:in_device} OUT=(%{WORD:out_device})? MAC=%{NETFILTERMAC} SRC=%{IP:src_ip} DST=%{IP:dst_ip}.*(TTL=%{INT:ttl})?.*PROTO=%{INT:proto}?.*)
IPTABLES (?:%{IPTABLES1}|%{IPTABLES2})
You'll also need to declare this directory in Logstash's config file (see below). Now let's process our iptables logs, create or edit a logstash config file :
input {
  file {
    path => [ "/var/log/syslog" ]
    type => "iptables"
  }
}

filter {
  if [type] == "iptables" {
    grok {
      patterns_dir => "/usr/share/grok/patterns/iptables"
      pattern => "%{IPTABLES}"
    }
  }
}

output {
  # Check that the processed line matched against grok iptables pattern
  if !("_grokparsefailure" in [tags]) {
    redis { host => "10.0.0.5" data_type => "list" key => "logstash" }
  }
}
Actually, despite the very useful Grok Debugger, I couldn't get these this pattern working. Plus, you will have to guess one way or another wether the log line is a REJECT, DROP, ACCEPT or whatever. To make this simpler, you may use iptables rules like this :
iptables -N LogAndDrop
iptables -A LogAndDrop -p tcp -j LOG --log-prefix "RULE 1 -- DROP " --log-level=info
iptables -A LogAndDrop -j DROP
You can also create rules for REJECT / ACCEPT rules following this one. Good thing is that your iptables log lines will now be prefixed with a "DROP" (or REJECT / ACCEPT), allowing you to process these log lines in a different way, measuring ACCEPT vs. DROP/REJECT count for instance. Here is the grok pattern you can use :
IPTABLES (.*RULE \d? -- (%{WORD:action})?.*SRC=(%{IP:src_ip}).*DST=(%{IP:dst_ip}).*PROTO=(%{WORD:protocol}).*SPT=%{INT:src_port}?.*DPT=%{INT:dst_port}?.*)
The following fields will be extracted for you iptables logs :
- action = depending on what you set in your custom iptables rules, may be REJECT, DROP, ACCEPT ...
- src_ip = source IP address
- dst_ip = destination IP address
- protocol = protocol (TCP, UDP, ICMP, etc.)
- src_port = source port number
- dst_port = destination port number
You'll probably notice that not all the data available in the logs is exctracted, feel free to adapt the grok pattern upon your specific needs.
Note that if you decide to create a "log & accept" iptables rule, it's definitely NOT a good idea to systematically use it instead of the regular ACCEPT one. You'd rather use it to track connections from specific IP addresses ranges for example.
system logs (syslog) processing
Edit your existing one or create a new Logstash config file :
input {
  file {
    path => [ "/var/log/*.log", "/var/log/messages", "/var/log/syslog" ]
    type => "syslog"
  }
}

output {
  redis { host => "10.0.0.5" data_type => "list" key => "logstash" }
}
As each log line may have a different format, they will each be stored "as is" in the "message" field in Elasticsearch. Anyway, this will not prevent you from analyzing this data (by example getting the number of (un)successful authentications from auth.log).
Elasticsearch

Thanks to a Debian package available on Elasticsearch's official download page, a few command lines only will be sufficient to get it up and running :
$ sudo aptitude install openjdk-7-jre-headless
$ wget https://download.elasticsearch.org/elasticsearch/elasticsearch/elasticsearch-0.90.7.deb
$ sudo dpkg -i elasticsearch
Elasticsearch should have started automatically, open your browser and reach http://yourhostname:9200/. If everything wen fine, you should get a JSON response looking like this :
{
  "ok": true,
  "status": 200,
  "name": "Alibar",
  "version": {
    "number": "0.90.7",
    "build_hash": "36897d07dadcb70a865b7f149e645ed3d44eb5f2",
    "build_timestamp": "2013-11-13T12:06:54Z",
    "build_snapshot": false,
    "lucene_version": "4.5.1"
  },
  "tagline": "You Know, for Search"
}
If necessary, you can tune Elasticsearch's run parameters in /etc/default/elasticsearch and configuration parameters in /etc/elasticsearch/
Logstash (indexer)
Thanks to a comment from DJP78, I realized that I forgot to explain how to configure Logstash on the indexer side : pulling logs data from Redis and storing them into Elasticsearch. Here is the Logstash config you can use (note that I also process local
input {
  file {
    type => "syslog"
    path => [ "/var/log/*.log", "/var/log/messages", "/var/log/syslog" ]
  }
  redis {
    host => "127.0.0.1"
    data_type => "list"
    key => "logstash"
    codec => json
  }
}
output {
  elasticsearch { bind_host => "127.0.0.1" }
}
You can check if Logstash is correctly doing his job on the indexer, by either watching the list size decrease in Redis (redis-cli and then LLEN logstash) or searching your Elasticsearch index via a HTTP GET request : http://yourElasticSearchHostname:9200/_search?q=_index%20like%20logstash%25&sort=@timestamp:desc.
Kibana
Finally, let's install Kibana. Kibana is a modern & dynamic (AngularJS based) frontend for Logstash / Elasticsearch, allowing you to get charts, tables, etc. from your collected logs data.

All you need to use Kibana is a HTTP web server and access to Elasticsearch's port 9200 (from your browser). It's installation is quite straight-forward :
$ sudo aptitude install git
$ cd /var/www
$ git clone https://github.com/elasticsearch/kibana.git kibana
Now open http://yourhostname/kibana/ in your browser. Tada !
Note that if Elasticsearch is not installed on the same server (or available through the same hostname) as Elasticsearch, you'll need to configure it's hostname (and possibly port) in config.js at Kibana's root.
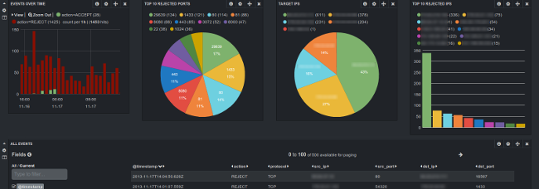
On first launch, Kibana offers you to use a "Logstash dashboard", click on the link. You can now see your logs data in a table, try to activate some useful fields in the left column, or create your first graph :-).
tl;dr
- Download Logstash on all your "shippers" and your "indexer"
- Install and launch Redis on your "indexer"
- Install and launch Elasticsearch on your "indexer"
- Clone Kibana git repository on your "indexer" in /var/www
- Create Logstash config files for your shippers and indexer (see above), launch all Logstash instances

I'm Michael BOUVY, CTO and co-founder of Click&Mortar, a digital agency based in Paris, France, specialized in e-commerce.
Over the last years, I've worked as an Engineering Manager and CTO for brands like Zadig&Voltaire and Maisons du Monde.
With more than 10 years experience in e-commerce platforms, I'm always looking for new challenges, feel free to get in touch!