Graph your sensors data with RRDtool
![]()
As I am, you may be using your Arduino to gather data from sensors. These could be analog sensors : temperature, humidity, light, infrared receiver, or digital sensors : door switch (hall effect), mecanic switch, etc.
I chose to store all these data to a MySQL database (over a network connection) so I can process these later as I with.
Of course, depending on how often you're polling your sensors, you may quickly have hundred thousands or even millions entries in your database.
After giving a try to Amcharts, a Javascript graphing library, I eventually decided to use RRDtool to graph my data.
That choice allows me to exclusively focus on graph generation, without worrying how data is fetched, if data is time based or not, etc. In this article, I'll be specifically covering temperature databases / graphing, as these are the most common (and useful) data collected.
Creating the Round Robin Database
In your favorite terminal, type the following (in your working directory, i.e. your home directory) :
rrdtool create temperatures.rrd \
--step 300 \
-b 123456789 \
DS:temp1:GAUGE:600:0:50 \
DS:temp2:GAUGE:600:0:50 \
RRA:MAX:0.5:1:288
Let's explain the above command line :
- rrdtool create temperatures.rrd : create database in file temperatures.rrd
- --step 300 : we are expecting a 300 seconds (5 minutes) maximum interval between each value
- -b 123456789 : (optional) it is useful if you plan to insert older values (with a timestamp in the past) ; otherwise, rrdtool will only accept values post the database creation date (replace 123456789 with the oldest timestamp of your data)
- DS:temp1:GAUGE:600:0:50 :
- add a data source called temp1 which has values between 0 and 50 (large enough for inside temp in degrees Celsius) ;
- GAUGE means this is absolute data that shouldn't be modified in any way by rrdtool, which is the best option for temperatures ;
- 900 is heartbeat timeout value in seconds : if no data is added within this interval, zero value will be inserted (that will show up as blank on your graphs)
- DS:temp2:GAUGE:600:0:50 : same thing as temp1 data source, you may add as many as needed
- RRA:MAX:0.5:1:288 : Round Robin Archive, we define how much data we will store and for how long ;
- MAX means that only one value (the maximal) should be taken if several are available ;
- 0.5 should be kept as is (internal resolution) ;
- 1 specifies that only one step is necessary to store final value, no average is made ;
- 288 is the number of steps that we will store in our database, in our case, 288 * 300 = 86400 seconds = 1 day ; you may by example set this value to 2016 (7 days)
You should now have a file called temperatures.rrd in your current directory.
Adding data to the rrd database (rrdtool update)
This step is the easiest one. In your terminal, type :
rrdtool update temperatures.rrd N:22:23
A few explainations of this command line :
- temperatures.rrd : database we're adding data to
- N:22:23 :
- N : use current time as timestamp ; you may here specify the unix timestamp you want (as long as it's post creation or start date of your rrd database)
- 22 : value for the first data source (temp1)
- 23 : value for the seocnd data source (temp2)
Note that you may also use the -t modifier to specify the data sources you're supplying data for. For more details, you can refer to the official documentation of rrdupdate. To keep your rrd database up to date, the best option is to set up a cron task that will update it every 5 minutes with the last data available. Let's make it to the next step : graphing the data !
Generating your graph
This part is where all the magic happens.
rrdtool graph temp_graph.png \
-w 785 -h 120 -a PNG \
--slope-mode \
--start -604800 --end now \
--vertical-label "temperature (°C)" \
DEF:temp1=temperatures.rrd:temp1:MAX \
DEF:temp2=temperatures.rrd:temp2:MAX \
LINE1:temp1#ff0000:"temp 1" \
LINE1:temp2#0000ff:"temp 2"
Explainations of the above command line :
- rrdtool graph temp_graph.png : generate the graph in a file called temp_graph.png in the current directory
- -w 785 -h 120 -a PNG : width 785, height 120, PNG format
- --slode-mode : smooth line
- --start -604800 --end now : graph begins 7 days ago (604800 seconds) and ends now
- --vertical-label "temperature (°C)" : vertical axis label
- DEF:temp1=temperatures.rrd:temp1:MAX : we are using temp1 data source from temperatures.rrd
- DEF:temp2=temperatures.rrd:temp2:MAX : same as temp1
- LINE1:temp1#ff0000:"temp 1" : draw temp1 as a red line with "temp 1" label
- LINE1:temp2#0000ff:"temp 2" : draw temp2 as a blue line with "temp 2" label
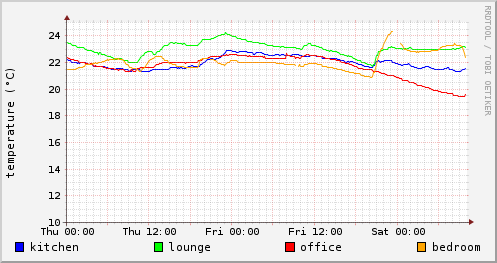
If you're working on a remote server, copy your newly created graph to some directory in your webserver path and reach it via it's URL. Tada ! Here are my 4 temp sensors values graphed :
Thanks to this tutorial of Calomel.org for helping me understand RRDtool better and of course, do not hesitate to have a look at the official RRDtool documentation.

I'm Michael BOUVY, CTO and co-founder of Click&Mortar, a digital agency based in Paris, France, specialized in e-commerce.
Over the last years, I've worked as an Engineering Manager and CTO for brands like Zadig&Voltaire and Maisons du Monde.
With more than 10 years experience in e-commerce platforms, I'm always looking for new challenges, feel free to get in touch!